Phases:
- PERFUSION PHASE
- CORTICAL PHASE
- EXCRETION PHASE
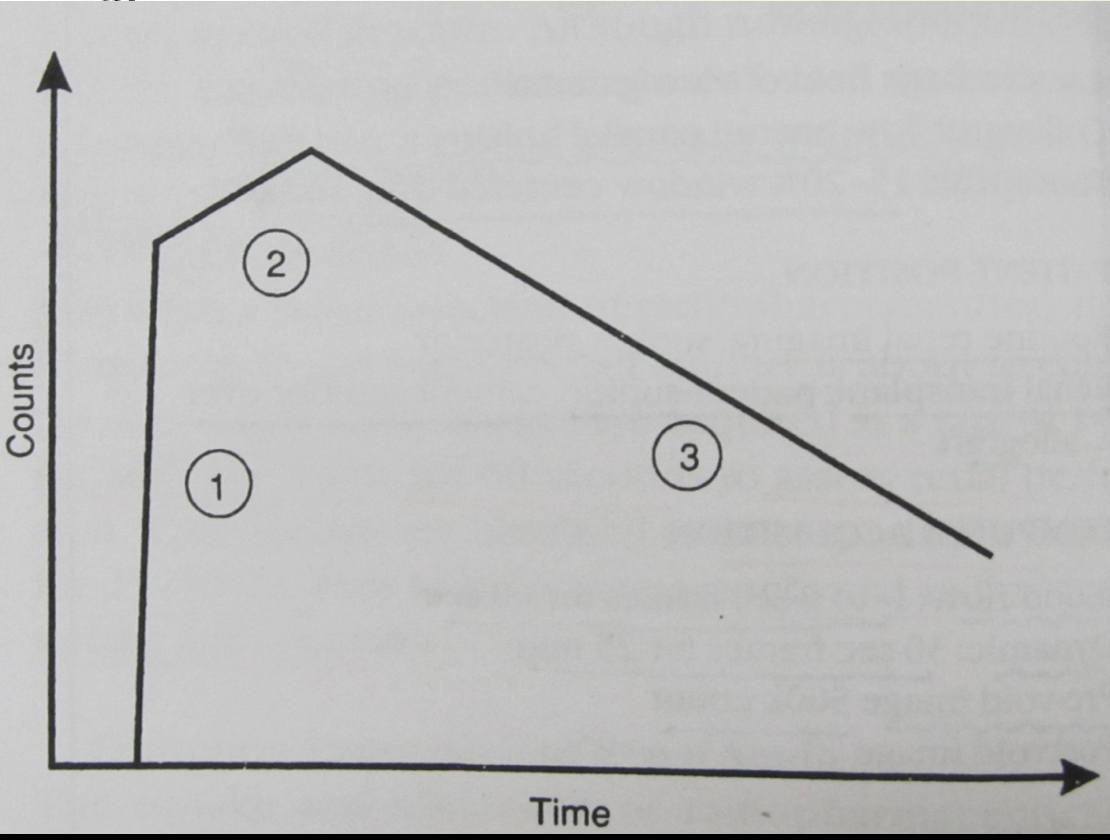
Perfusion/flow phase
- Blood flow to the kidneys seen immediately after flow appears in adjacent artery
- Delayed visualization:
- Artifactual: suboptimal injection technique
- If slope of arterial TAC is not steep or if activity persists in heart and lungs, injection may have been given over too long a period
- Asymmetry in tracer activity suggests abnormal perfusion in decreased or delayed side
- Small kidney: less flow due to decrease in parenchymal tissue volume
Cortical uptake phase
- Tracer uptake in parenchymal tissues in 1-3 min
- Cortex should appear homogeneous
- Calyces and renal pelvis are either not seen or appear photopenic
- If there is decreased function on one side, rate of uptake and function are delayed compared to the opposite side, producing a “flip-flop” pattern, ie. Poorly functioning side initially has lower uptake, but the cortical activity on later images is higher than on the better functioning side, which has already excreted the tracer.
- T max:
- The time during which tracer is concentrated in the cortex before excretion into the calyces begins
- Usually 3-5 minutes
Clearance Phase
- Calyces and pelvis begin filling by 3 min
- In next 10-15 min activity in cortex decreases and collecting system increases
- Normally tracer clears into the bladder by the end of the dynamic study
- Normal variation: Pooling of tracer in dependent calyces appear as focal hot spots
- Lack of clearance or overlap of pelvicalyceal structures onto the cortex : Hydronephrosis
- A distended bladder can cause an obstructed pattern
TYPES
- Described by O’Reilly
TYPE I
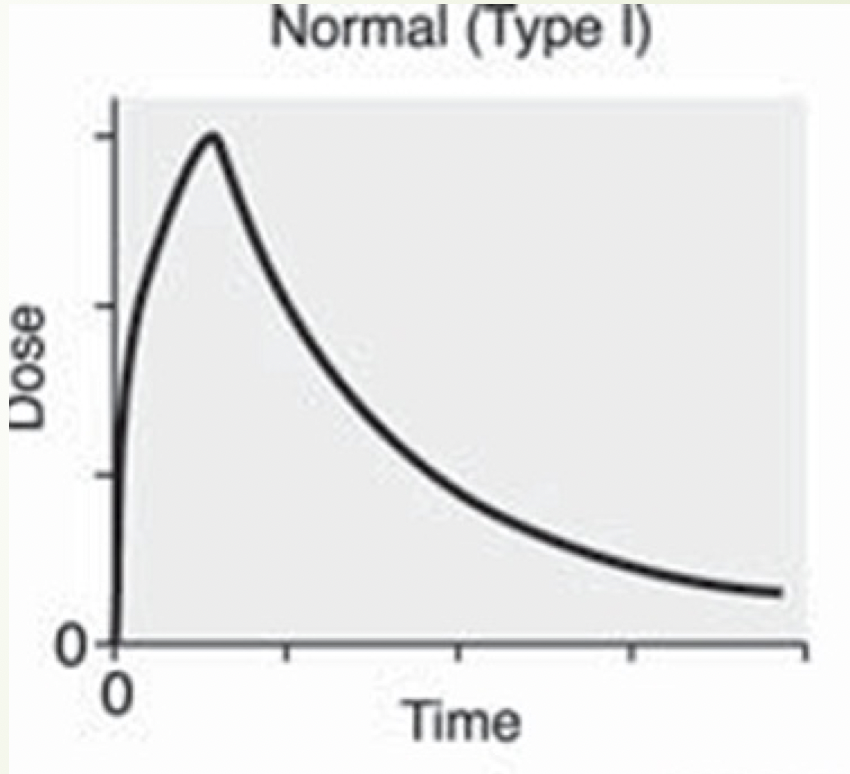
- Type I curve: corresponds to a normal drainage before diuresis: Normal study
TYPE II
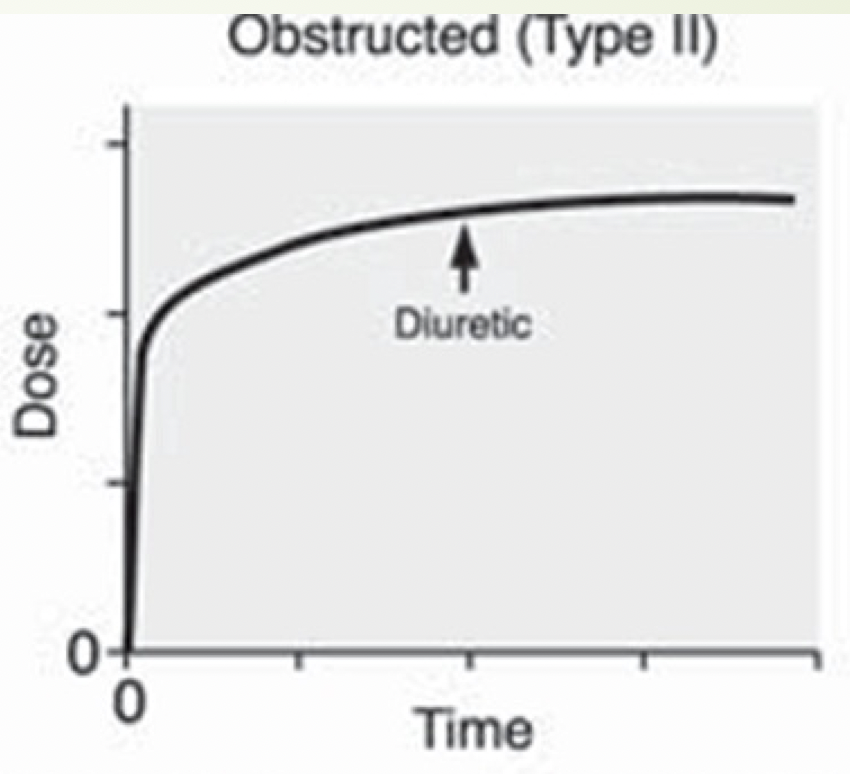
Obstructed Pattern
Rule out:
- Severe dehydration
- Poor renal function
- Massively dilated PCS
- Bladder effect
TYPE IIIa
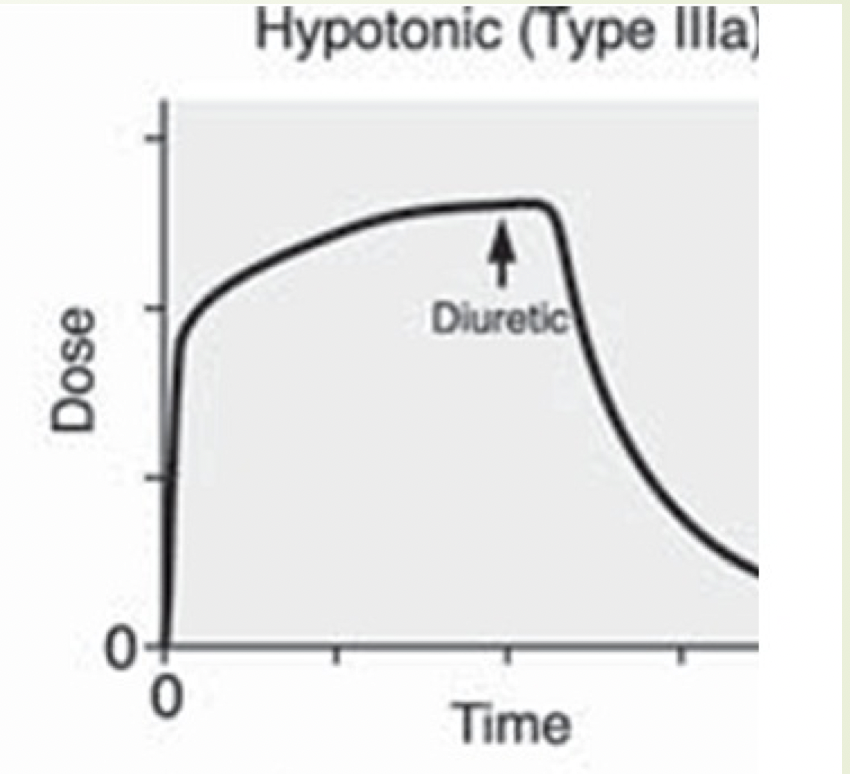
- characterised by a sharp response to diuretic injection.
- In this case, dilation represents stasis and not obstruction.
TYPE IIIb
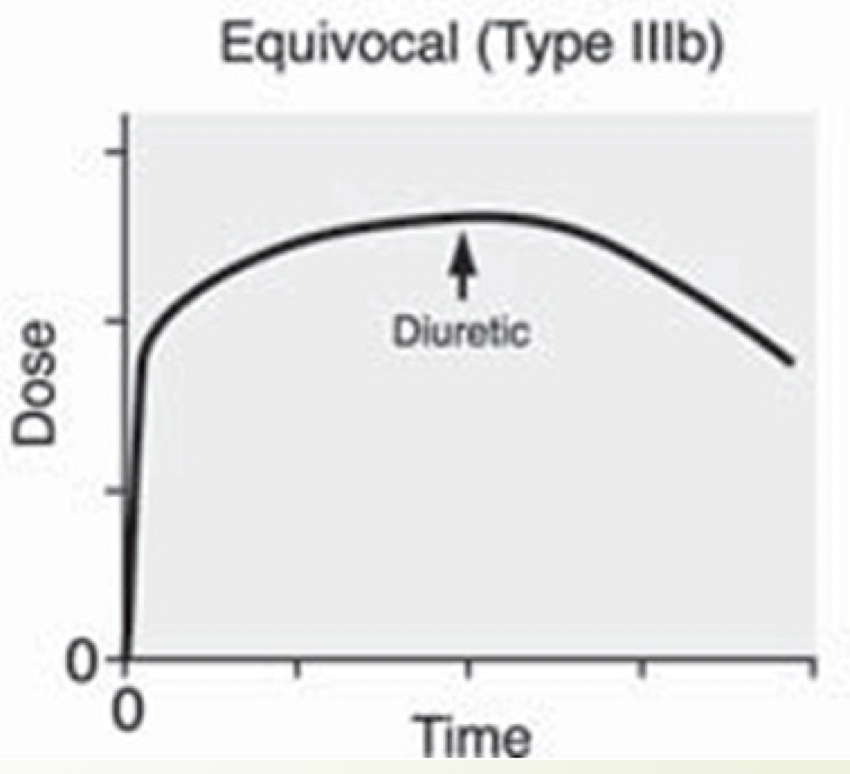
- equivocal response
- In this case, there is some response to furosemide although it is not as marked as in type IIIa
TYPE IV
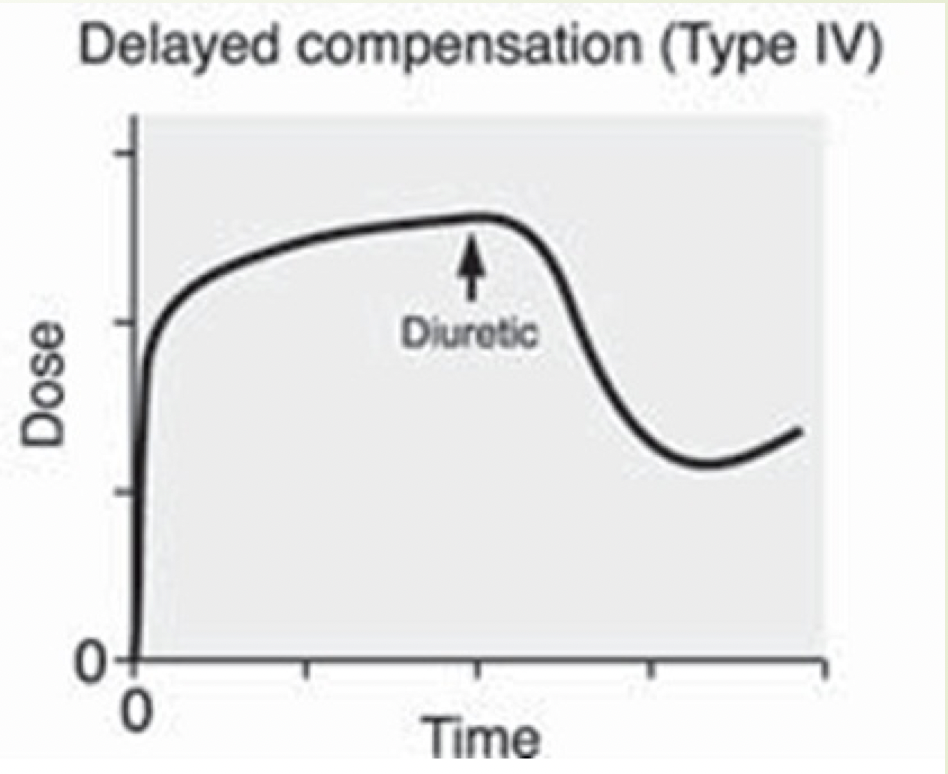
- In some patients, initially rapid elimination in response to furosemide gives way after a short time to a sudden cessation of elimination or reversion to a rising curve
- response known as Homsy’s, or delayed double-peak, sign, which is an indicator of intermittent hydronephrosis